| Category | 2014 | 2015 | 2016 | |
|---|---|---|---|---|
| Non Renewable Raw Materials | Plastics1) | 8,724 | 9,185 | 10,017 |
| Metal | 4,056 | 4,332 | 5,096 | |
| Theoretical weight applied2) | 1,983 | 2,266 | 2,335 | |
| Renewable Raw Maerials | - | - | - | |
| Total | 14,763 | 15,783 | 17,448 | |
According to features of manufacturing facility that operates the produt assembly-oriented and inspection processes, so the company’s environmental impact on water resources through its water use or the discharge of waste water is not significant. Still, Coway is adamant about reducing its water use. One way it has done this is by developing a “waterless” water purifier test system that uses nitrogen and vacuum conditions instead of water. Additionally, Coway was the first Korean company to become a signatory of the UNGC CEO Water Mandate, and has done its best to protect water resources throughout the production process.
| Category | 2014 | 2015 | 2016 |
|---|---|---|---|
| Yugu Plant | 31,221 | 30,916 | 40,083 |
| Incheon Plant | 12,151 | 16,603 | 16,711 |
| Pocheon Plant | 340 | 235 | 146 |
| Environmental Technology Institute(R&D Center) | 19,995 | 15,104 | 19,358 |
| Logistics Center(Yugu) | 2,340 | 3,386 | 4,071 |
| Total | 66,047 | 66,244 | 80,369 |
In order to increase the efficiency of energy use, Coway installed photovoltaic generators at its production facilities and is expanding its use of renewable energy. The company also joined the Win-Win Energy Companion project, and offered energy quantification equipment to reinforce suppliers’ energy competitiveness.
| Category | Energy Source | 2014 | 2015 | 2016 |
|---|---|---|---|---|
| Direct | Butane(GJ) | 7 | 2 | 0.4 |
| LPG(GJ) | 44 | - | - | |
| Diesel(GJ) | 250 | 268 | 265 | |
| LNG(GJ) | 1,567 | 1,601 | 402 | |
| Kerosene(GJ) | 209 | 267 | 250 | |
| Propane(GJ) | 1,135 | 4,126 | 5,394 | |
| Direct Total(GJ) | 3,212 | 6,264 | 6,311 | |
| Indirect | Electricity(GJ) | 103,944 | 103,640 | 101,543 |
| Indirect Total(GJ) | 103,944 | 103,640 | 101,543 | |
| Total(GJ) | 107,155 | 109,903 | 107,854 |
| Category | Energy Source | 2014 | 2015 | 2016 |
|---|---|---|---|---|
| Energy Use per Unit (GJ/KRW 100 million) | 5.32 | 5.08 | 4.54 | |
| Total energy use(GJ)/Total sales(KRW 100 million) | ||||
| Adoption of Renewable Energy | installation costs(KRW 100 million) 1) | 2.0 | 1.7 | 11.9 |
| Reduction in power consumption(kw)2) | 71,528 | 189,457 | 900,435 | |
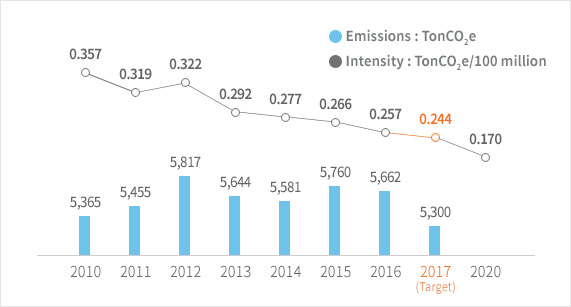
Coway is the only Korean company which declared its support for the ‘UN Frameworkcoway Convention on Climate Change’ agreed by 195 countries at the COP21 held in Paris in 2015 and has been participating in the corporate voluntary carbon reduction plan scheme. Coway plans to reduce the GHG emission per unit by 50% of the year 2010 by the year 2020 in order to accomplish the mid & long term reduction goal of greenhouse gas established in 2009. Accordingly, Coway has developed the energy saving activity participated in together by staff & employees and partners to minimize the greenhouse gas emission at all manufacturing and sales fields.
| Category(Unit : tCO2e) | 2014 | 2015 | 2016 |
|---|---|---|---|
| Direct Emissions(Scope1) | 196 | 391 | 401 |
| Indirect Emissions(Scope2) | 5,385 | 5,369 | 5,261 |
| Indirect Emissions(Scope1+2) | 5,581 | 5,760 | 5,662 |
| Yugu Plant | 1,919 | 2,015 | 2,165 |
| Incheon Plant | 634 | 658 | 677 |
| Pocheon Plant | 361 | 349 | 387 |
| Environmental Technology Institute(R&D Center) | 1,537 | 1,565 | 1,588 |
| Cosmetics Research Institute | 163 | 174 | 183 |
| Seoul Office(JoongAng Dail yBuilding) | 399 | 390 | 382 |
| Logistics Center(Yugu) | 413 | 464 | 328 |
| Net Emissions(CO₂e/KRW100) | 0.277 | 0.266 | 0.257 |
| Domestic Logistics and Transport(Scope 3) | 4,025 | 4,514 | 4,795 |
| Commuting Vehicles(Scope 3) | 49 | 49 | 49 |
In order to minimize the environmental pollution caused by the refrigerant used in the product, it switching to environmentally friendly refrigerants. Refrigerant (R-134a) used in existing products is handled through a company designated by Ministry of Environment.
| Category | R-134a1) | ||
|---|---|---|---|
| 2014 | 2015 | 2016 | |
| Use of Refrigerants in Product Manufacturing(kg) | 43,867 | 50,238 | 52,340 |
| Use of Refrigerants in Product Disposal(Kg) | 13,558 | 15,562 | 20,188 |
| GHG Emissions Caused by Refrigerants from Waste Products(tCO2e) | 14,073 | 16,185 | 20,996 |
| Use of Eco-friendly Refrigerants in Product Manufacturing(kg) |
R-600a, R-436B | ||
| 2,440 | 651 | 950 | |
| Category | 2014 | 2015 | 2016 | |
|---|---|---|---|---|
| Generation of Waste | Products | 12,808 | 13,263 | 14,024 |
| Business Site: General | 1,028 | 1,023 | 1,619 | |
| Business Site: Designated | 26 | 27 | 38 | |
| Services | 7,024 | 8,501 | 9,095 | |
| Total (Unit: tons) | 20,886 | 22,814 | 24,776 | |
| Amount of Waste Recycled (Unit: tons) | 12,228 | 12,837 | 13,559 | |
| Waste Recycling Rate (%) | 59 | 56 | 55 | |
Coway has expanded its management scope from the manufacturing and distribution of products to waste that occurs during its service process, as CODYs recollect waste filters after carrying out their services, thus enabling waste separation.
| Category | 2014 | 2015 | 2016 |
|---|---|---|---|
| Output(tons) 1) | 8,724 | 9,185 | 10,017 |
| Amount Recycled(tons) 2) | 6,198 | 6,353 | 6,902 |
| Recycling Rate (%) 3) | 71.1 | 69 | 69 |
For customers who purchase new products and dispose of existing ones, Coway collects the used products free of charge. The recollected products are handled at the company’s Recycling Center, where plastics are recycled, some of which are later sold as refurbished products. In 2013, Coway signed an MOU with the Ministry of Environment and the Korean Environment Corporation on this very issue and has been working hard to facilitate the sale of refurbished products since then.
| Category(Unit: No. of units) | 2014 | 2015 | 2016 |
|---|---|---|---|
| Water Filtration Appliances | 12,061 | 13,492 | 9,165 |
| Air Purifiers | 2,672 | 4,508 | 6,584 |
| Water Softeners | 366 | 49 | 1 |
| Bidets | 3,454 | 3,486 | 5,362 |
| Food Waste Treatment Appliances | 30 | - | - |
| Total | 28,123 | 18,583 | 21,112 |
In order to reduce the environmental impact of the business activities, Coway is striving to strengthen environment-friendly investments in facilities and systems and to comply with environmental laws and regulations. As a result of these efforts, there have been no cases of environmental regulations violations in 2016.
| Category(Unit: KRW million) | 2014 | 2015 | 2016 |
|---|---|---|---|
| Facility Operations | 186.5 | 71.3 | 322.1 |
| System Operations | 66.5 | 119.9 | 95.9 |
| Communication | 616.0 | 373.7 | 181.5 |
| New Environmental Businesses | 59.0 | 149.2 | - |
| Total | 928.0 | 714 | 599.4 |
| Category (Unit: KRW 100 million) | 2014 | 2015 | 2016 |
|---|---|---|---|
| Sales | 6,034 | 5,972 | 6,292 |
Coway operates a hazardous substance process management system to minimize the amount of hazardous substances contained in its products.Since 2006, The company has responded to environmental regulations such as EU RoHS and WEEE for exports to Europe, and is responding to Korea’s Act on the Resource Circulation of Electrical and Electronic Equipment and Vehicles ever since Coway products fell under the terms of the law in 2014.
| Category(Unit: %) | 2014 | 2015 | 2016 |
|---|---|---|---|
| Response Rate to Parts Containing Hazardous Substances | 100 | 100 | 100 |
Coway’s Green Partnership (GP) certification system helps Coway to produce eco- friendly products and offers Green Partner certificates for suppliers that meet Coway’s stringent environmental & quality management standards.
| Category | 2014 | 2015 | 2016 |
|---|---|---|---|
| Suppliers Certified with Coway’s Green Partnership Certificate | 55 | 55 | 100 |
Coway has selected 26 suppliers that deliver major raw materials in large trade amounts and energy use, and now maintains carbon partnerships with them. Every year, the company measures these key suppliers’ GHG emissions and emissions per unit, reinforcing their response capabilities to climate change.
| Category | Period | Major Description |
|---|---|---|
| Win-Win Energy Partnership | May ~ September 2016 | Diagnosis of energy issues at business sites(Encourage investment) |
Coway continuously supports carbon partnership suppliers and reinforces their competitiveness by encouraging them to reduce energy use in relation to sales growth. In doing so, Coway is successfully reducing suppliers’ environmental risks duecoway to climate change.
| Category | 2014 | 2015 | 2016 |
|---|---|---|---|
| GHG Emissions(tCO2e) | 44,445 | 36,181 | 40,994 |
| Emissions per Unit(tCO2e/KRW 100 million) | 10.56 | 8.46 | 8.02 |


